Why Battleboard™ Trumps Traditional Competitor Analysis for Today’s CEO


If your competitors shifted strategy tomorrow, would your team catch it before it hit your bottom line?
For most companies, the honest answer is probably not.
Despite operating in a data-rich era, competitive analysis is still treated as a side task performed occasionally, interpreted narrowly, and often used reactively.
Though praised as a pillar of business strategy, competitive analysis remains one of the most misunderstood and underutilized tools in the executive arsenal. In many organizations, it’s less a strategic function and more a checkbox on the planning calendar, creating the illusion that they’ve covered their bases. But what they end up with is a hollow sense of awareness. Teams walk away feeling informed but act on incomplete, surface-level clarity. They’re gathering data but not gaining insight.
Traditional models weren’t designed for the breakneck speed, layered complexity, and fluid competition of today’s AI-fueled markets. They often miss the subtle forces that shape strategic advantage: brand equity, customer advocacy, operational precision, digital traction, and narrative control.
CEOs who rely on outdated competitor matrices risk misjudging threats, missing hidden opportunities, and steering their companies based on assumptions rather than actionable insights. It’s like surveying a battlefield with binoculars when what you really need is a command center. Binoculars might help you spot movement, but they can’t reveal intent, map shifting terrain, or coordinate your response. A command center offers the full picture, including real-time updates, predictive insights, and a clear view of where to strike and where to defend.
In this blog, we’ll explore why it’s time to retire the binoculars and embrace the command center and why Battleboard™ is the strategic cockpit today’s CEOs need to navigate, outpace, and outthink the competition in real-time.

At its core, competitor analysis is about understanding who you’re up against and how your brand stacks up strategically, operationally, and emotionally. It traditionally involves identifying competitors, analyzing their product offerings, pricing, marketing strategies, and customer experiences, and ultimately assessing where you stand in relation.
On paper, this sounds comprehensive. However, in practice, most traditional analyses are akin to peering at the horizon with a pair of binoculars, providing a limited, fixed-angle view rather than a 360-degree operational picture.
Let’s walk through the foundational components of how traditional competitor analysis is structured:
Before you can understand your position in the market, you need to identify who else is in the arena. The common approach begins by categorizing competitors into a few distinct types:
While this segmentation is a necessary starting point, one critical issue is often overlooked: scope management. In digital-first markets, the list of potential competitors can balloon into the hundreds. The goal isn’t to monitor everyone; it’s to monitor the right ones deeply and continuously.
And this is where most teams stall: they stop at identification. They build a list but fail to build context. True competitive strategy doesn’t stop at recognizing who’s out there; it starts when you understand their intent, track their evolution, and evaluate their impact on your positioning and your future.
Once competitors are identified, most traditional teams shift to the comparison phase, usually via a multi-dimensional competitive analysis matrix like the one shown above. This matrix rates each competitor, along with your own brand, across attributes such as product features, pricing, content strategy, logistics, customer reviews, and visibility in organic and paid channels.
These analyses are usually built manually and pieced together from internal team knowledge, public data, and online research. Tools like Excel, Google Sheets, or static slide decks remain the go-to formats. To supplement, many teams pull signals from platforms like Similarweb, SEMrush, BuiltWith, or Crayon. While these tools offer valuable data, they are often tacked onto a conventional process, not embedded into a living strategy system.
And that’s where the problem lies.
These models give the illusion of structure but often lack strategic depth. It tells you what your competitors are doing but not why, how well, or what to do next. It’s like analyzing troop formations from yesterday’s battlefield to plan today’s attack. The terrain has already shifted, new players have entered the field, and your opponents are on the move while your team is still reviewing last week’s intel.
Traditional analytical frameworks have long provided structured ways to interpret strategic and market data. Some directly address competitors, while others shape how businesses understand the competitive landscape. They’re still valuable, but they have constraints in today’s fast-moving business environment.
SWOT (Strengths, Weaknesses, Opportunities, and Threats) is a commonly used framework in competitive analysis. It helps businesses assess their own position and their competitors’ potential impact. However, it’s often limited to a point-in-time reflection. In volatile markets, strengths today may be irrelevant tomorrow. And without quantification, SWOT assessments easily fall prey to internal biases.
In theory, competitor profiling offers deep insight into a rival’s brand DNA. In practice, many teams reduce profiling to surface-level data: funding amounts, headcount, or a few press mentions. Done right, this should resemble psychographic profiling for companies, not just a data sheet.
Perceptual maps visually plot customer perceptions of various brands across selected axes (e.g., price vs. quality, innovation vs. usability). They help identify whitespace opportunities or oversaturated zones. However, their value depends entirely on the accuracy and freshness of the input data. Outdated or overly subjective perception data can lead to misleading visualizations.
Porter’s Five Forces framework evaluates industry attractiveness based on supplier power, buyer power, competitive rivalry, threat of new entrants, and substitutes. It’s a classic for assessing structural market dynamics, but it’s not designed for tracking real-time evolution or short-term disruption caused by startups or pivots.
PESTEL (Political, Economic, Social, Technological, Environmental, Legal) helps teams zoom out and evaluate the broader context. While insightful for regulatory or societal shifts, it lacks the granularity needed for day-to-day competitive maneuvering. Moreover, it’s rarely updated frequently enough to reflect dynamic market signals.
Even with solid frameworks, traditional competitive analysis suffers from inherent limitations:
What is rarely discussed is how traditional frameworks fail to connect market intelligence to operational strategy. They identify gaps but don’t say what to do about them.
You wouldn’t navigate a modern battlefield with hand-drawn maps. Why are so many businesses still using one to plot their competitive strategy?
To modernize competitive analysis, strategic teams should incorporate overlooked but high-impact factors that reveal not just what a competitor is doing but why and how well. While some of these factors may vary in relevance by industry, they represent a powerful toolkit for deeper competitive insight.
Emerging hiring patterns can hint at product roadmap directions, regional expansions, or new technology bets.
Instead of just collecting star ratings or reviews, track the tone and velocity of customer feedback over time. Are they getting more negative or positive? Are complaints increasing in a specific product line?
What themes are competitors leaning into? How frequently are they updating their messaging? Are they shifting focus from “features” to “transformation”? Content tracking tools can help you reveal how brand storytelling is evolving.
Most teams compare product features based on checklists. But what matters more is which features customers are actually using and raving about. Look at changelogs, community forums, and feature request boards to spot what’s sticking, not just what’s shipped.
Is the competitor expanding partnerships, integrations, or alliances? Growth here often signals ecosystem plays, platform strategies, or indirect GTM expansions. These alliances can quietly reshape market positioning before they’re reflected in sales.
These hidden indicators provide sharper insight into strategic intent, operational momentum, and future positioning. But manually piecing them together is tedious, error-prone, and disconnected from real-time change.
That’s why static analysis isn’t enough anymore. What today’s CEOs need is a smarter, integrated way to measure competitive movement, not once a quarter, but continuously.
That’s where ImpelHub’s Battleboard™ comes in as your always-on competitive command center.
In a market where hundreds of companies can look similar on the surface, ImpelHub’s approach begins with a sharper question:
Who are the few competitors that actually matter to your growth, and what should you do about them?
At the center of ImpelHub’s methodology is CounterEdge, a system powered by FoeScan, its proprietary competitor intelligence engine. Unlike generic comparisons, FoeScan blends strategic filtering, algorithmic scoring, and human validation to turn competitor data into action-ready strategies.
FoeScan begins by systematically scanning your competitive landscape, not based on guesses or shortcuts, but through a proprietary multi-factor algorithm. Each potential competitor is assessed across 10 core similarity dimensions, such as product or service offerings, target audience, company size, geographic reach, industry, etc.
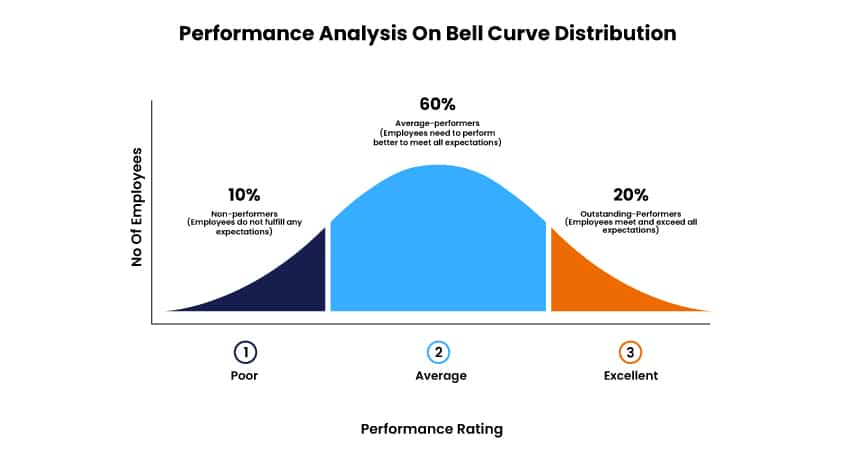
But it doesn’t stop at listing names. These dimensions are weighted, scored, and plotted across a bell curve as shown above to filter signal from noise:
The result is a refined shortlist of your top 5 competitors, those most similar, most active, and most likely to influence your trajectory. You then validate this list in a client review checkpoint to align the algorithmic output with real-world context.
After FoeScan identifies the most relevant competitors, it shifts focus to their top strategic plays and what they’re doing in the market to win attention, revenue, or loyalty.
ImpelHub then uses its internal database, trend analysis, and manual verification to decode these competitive strategies and generate custom counter-strategies based on:
What makes CounterEdge powerful is its focus on relevance and impact. It observes and evaluates how competitor actions affect your business and where your response should focus.
With key rivals mapped and countermoves generated, the groundwork is set for Battleboard™, ImpelHub’s dynamic strategy board.
Knowing your top competitors is step one. But knowing where you stand against them, dimension by dimension, strategy by strategy, is where real competitive clarity begins. That’s exactly what ImpelHub’s Battleboard™ delivers.
Battleboard™ is a precision strategy mapping tool designed to benchmark your business against your top competitors across more than 20 industry-specific dimensions, helping you understand exactly where you stand, why it matters, and what to do next.
It offers a single, unified view of your brand’s performance that goes far beyond feature comparison or surface-level benchmarking. Instead, it reveals:
Every industry is different, but the principles of strategic differentiation are constant. Battleboard™ organizes its analysis across a list of core categories tailored to your market. Here are some examples.
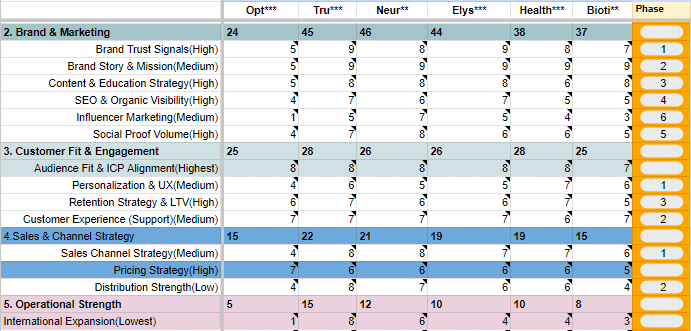
Within each category, your brand is benchmarked against competitors across specific dimensions, scored on a 0–10 scale, each backed by a clear rationale and supporting data.
But here’s what sets Battleboard™ apart: you’re not just a spectator. You’re part of the scoring process. ImpelHub invites you to validate or adjust scores based on your internal insight so the final picture reflects both external data and your organizational intelligence.
To make the data actionable, Battleboard™ distills all dimensions into a visual head-to-head comparison, putting your brand and your top five competitors side by side.
This isn’t just about who’s ahead in features or marketing spend. It’s a multi-dimensional view of competitive performance across categories that matter. Each score is enriched with impact insights, so you’re not just seeing where you differ but how much it matters.
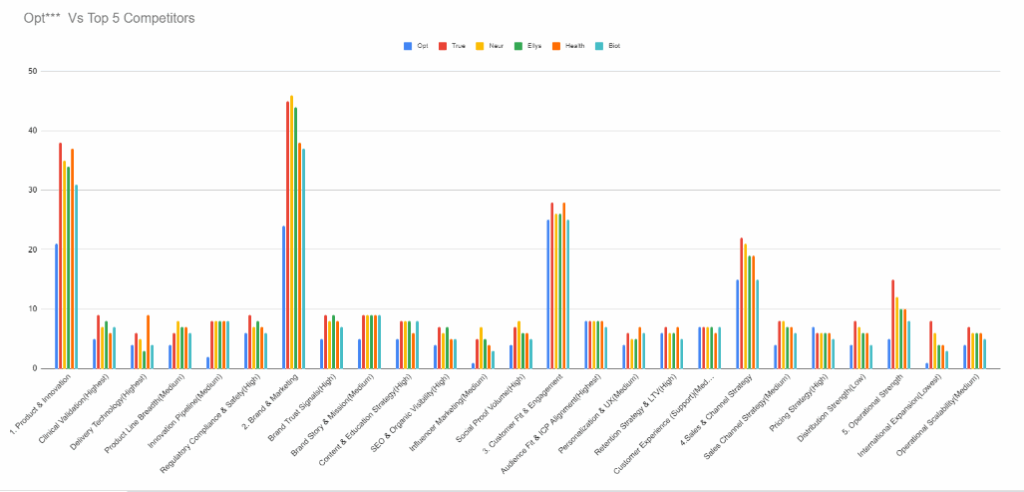
The above graph illustrates:
It’s the kind of analysis that translates easily across teams without needing to interpret 40-page decks or scattered spreadsheets.
It’s the difference between glancing at the battlefield through binoculars and stepping into a live command center. Binoculars might show you who’s nearby. But a command center reveals how fast they’re moving, which direction they’re heading, and where you’re exposed. That’s what Battleboard™ brings to the table.
With your true position now visible, it’s time to act. And that’s where NextMove begins, scoring and prioritizing the smartest strategies for growth based on data, impact, and innovation.
With positioning established and gaps identified, the next challenge is clarity: Which counter-strategies are worth pursuing? Which ones will actually move the needle?
NextMove tackles this head-on by evaluating every counter-strategy using two core metrics that reflect both performance potential and strategic boldness.
NextMove Evaluation Criteria | Description |
Impact Score (1–10) | Measures the potential effect of a strategy on key business metrics such as revenue growth, cost reduction, market reach, and efficiency. Higher scores indicate strategies likely to produce significant, measurable results. |
Innovation Score (1–10) | Assesses the uniqueness, scalability, and market-disrupting potential of a strategy. The more innovative and differentiated, the higher the score. Scores can be weighted to reflect your business priorities for tailored evaluation. |
Prioritization Process | After scoring, NextMove uses bell curve analysis and standard deviation to identify the top 16% of strategies that balance strong impact with high innovation. These become the prioritized strategic initiatives ready for execution. |
ImpelHub worked with a health supplement brand struggling in a saturated market. Traditional competitor lists weren’t helping.
TreatLyme, a specialist brand focused on Lyme disease support, faced a 40% revenue drop following Google’s SEO algorithm changes. The impact was worsened by fragmented platforms that disrupted user experience and weakened SEO performance.
Solution:
ImpelHub led the strategic transformation of TreatLyme by leveraging its AI-driven competitive analysis while collaborating with Virtina.
The Results:
Customer feedback praised the brand’s personalized supplement recommendations and tangible health benefits, highlighting the success of a data-driven, customer-focused strategy.
Feature | Traditional Frameworks | ImpelHub Battleboard™ |
Purpose | Conceptual understanding | Actionable, data-backed insights |
Scope | Broad strategic themes (strengths, market forces, etc.) | 20+ industry KPIs across five or more strategic categories |
Speed | Slow, manual | Real-time, automated |
Objectivity | Analyst-dependent | Standardized scoring metrics |
Update Frequency | Quarterly or yearly | Continuous updates and real-time monitoring |
Data Depth | High-level overviews but limited granularity | Strategic, granular insights |
Visualization | Text-heavy, conceptual diagrams | Interactive dashboards and visual scoreboards |
Prioritization | No inherent prioritization system | Bell curve and weighted scoring to highlight top strategic moves |
Collaboration | Static documents with limited input | Users can annotate, validate, and refine scores collaboratively |
Outcome | Strategic reflection | Strategy generation and execution planning |
Traditional competitor analysis frameworks often rely on static data and dense reports that are difficult to interpret and rarely revisited. Battleboard™, on the other hand, leverages dynamic, interactive visualizations to align with how modern executives absorb and act on information.
Here’s how Battleboard™ enhances strategic thinking:
By making insights visible, collaborative, and actionable, Battleboard™ shifts competitor analysis from a static reporting exercise to a high-impact, real-time strategic discipline.
Traditional competitor analysis no longer meets the demands of today’s fast-paced, AI-driven, and hyper-competitive markets. CEOs need clarity, not clutter. They need real-time insights, automated prioritization, and cross-functional visibility to stay ahead.
ImpelHub’s Battleboard™ is a strategic shift. It transforms how organizations understand competition, make decisions, and execute with confidence. It reveals not just what your competitors are doing but why it matters, how it impacts your position, and what you should do next.
Now is the time to stop relying on static models and start acting on dynamic intelligence.
If you’re ready to lead with sharper clarity, smarter strategy, and faster execution through real-time, data-driven insights, Battleboard™ isn’t just an upgrade you need; it’s the edge you can’t afford to miss.
Battleboard™ is ImpelHub’s AI-powered competitive positioning engine that maps your brand and key competitors across strategic business vectors like pricing power, innovation, product depth, go-to-market speed, and customer sentiment. It turns fragmented market data into an interactive, real-time grid that guides CEOs and CMOs on where to play and how to win.
Battleboard™ is designed for CEOs, CMOs, Heads of Strategy, Product Marketing Managers, and Growth Teams who want a live, strategic cockpit instead of static reports. It’s ideal for B2B companies navigating crowded or fast-evolving markets where traditional SWOTs and quarterly market reviews fall short.
Unlike traditional competitor grids or SWOT reports that are often subjective, outdated, or siloed:
Battleboard™ is continuously updated with the latest available data. Depending on the data source:
You get a dynamic, always-on overview, not a snapshot every quarter.
Yes. Battleboard™ supports integrations with:
This ensures no disruption to your existing workflows, just a smarter, faster layer of strategy.
No. While built for enterprise-grade strategy, Battleboard™ also benefits mid-sized and growth-stage companies looking to scale intelligently. Its modular setup allows smaller teams to start with a core stack and grow as needed.
It gives CEOs:
2 combos (1 competitor × 2 dimensions)
20 combos $5 per additional combo
100 combos $4 per additional combo
280 combos $3 per additional combo

7 Steps / 8 – 10 days / 2 – 3 hours of your time
Maximize your impact with ImpelHub’s Growth Lever Identifier—our AI-powered system that discovers your single biggest growth lever and accelerates your success. By analyzing your revenue streams, marketing channels, and core metrics, it highlights the most effective path to scalable growth and pinpoints your highest-ROI strategy, so you can focus on what truly matters, multiply your revenue, and stay ahead in today’s competitive market. Our clear, data-driven action plan ensures you can scale faster and more efficiently than ever.
Insight360, part of the “Your Business” pillar in the Business Brain/Context framework, delivers data-driven insights across 9 categories and 40+ business aspects, including market positioning, competition, revenue, trends, and brand identity.
It drives two key outputs:
With a multidimensional business view, Insight360 helps optimize positioning, enhance engagement, and accelerate growth.
Insight360+ expands on Insight360 with 15 additional dimensions, offering a deeper analysis of business strategy. It provides a self-reflective framework to uncover opportunities in:
With Insight360+, businesses refine strategies, strengthen positioning, and drive sustainable growth.
FanScope is a comprehensive catalog of buyer types, categorized by 10 key attributes, helping decision-makers assess and refine target audiences before segmentation.
As the first step in segmentation, FanScope informs:
By analyzing buyer roles, revenue segments, and purchase probabilities, FanScope enhances targeting, optimizes resources, and improves sales and marketing efficiency.
The Segmentation Module enhances customer targeting with Rated ICPs, Personas, and Firmographics (B2B), assessing each ICP across 22 attributes, including:
ICP Scoring evaluates profiles on 10 numerical dimensions, enabling businesses to prioritize high-value targets efficiently.
FoeScope is a competitive analysis framework that evaluates competitors across three revenue segments—small, medium, and large—relative to the business’s revenue. It assesses:
As a precursor to CounterEdge, FoeScope helps businesses identify and categorize key competitors, setting the stage for deeper competitive strategy development.
CounterEdge analyzes competitor growth strategies, their impact on the business, and countermeasures to stay competitive. It evaluates:
By leveraging CounterEdge, businesses can anticipate threats, mitigate risks, and implement winning strategies.
NextMove is a growth strategy framework that helps businesses identify, evaluate, and implement high-impact strategies. Each strategy is numerically rated across 10 dimensions, similar to ICP Rating, to prioritize the most effective paths for expansion.
With NextMove, businesses gain a data-driven approach to strategic growth, ensuring scalability, market expansion, and long-term success.
Launch-Execution Blueprint creates high-level execution plans for growth strategies, prioritizing them based on impact, feasibility, and business alignment.
By leveraging Launch-Execution Blueprint, businesses can streamline execution, focus on high-impact strategies, and drive measurable growth.
Maximize your impact with ImpelHub’s AI-powered Growth Lever Identifier. By analyzing revenue streams, marketing channels, and core metrics, it uncovers your biggest growth lever and highest-ROI strategy.
With a clear, data-driven action plan, you can focus on what matters, scale faster, and stay ahead in today’s competitive market.
Maximize your impact with ImpelHub’s Growth Lever Identifier—our AI-powered system that discovers your single biggest growth lever and accelerates your success. By analyzing your revenue streams, marketing channels, and core metrics, it highlights the most effective path to scalable growth and pinpoints your highest-ROI strategy, so you can focus on what truly matters, multiply your revenue, and stay ahead in today’s competitive market. Our clear, data-driven action plan ensures you can scale faster and more efficiently than ever.
Feature Gap Analysis is a powerful tool within ImpelHub that identifies missing or desired features based on the needs and expectations of the target audience. By leveraging Business Brain, it ensures that feature recommendations are strategically aligned with business goals and market demand.
Key Benefits:
Identifies Missing Features – Pinpoints gaps in the product or service offering.
Aligns with Target Audience Needs – Ensures features meet user expectations.
Prioritization via Impact Scoring – Helps decision-makers invest wisely.
Data-Driven Scoring Mechanism
Each feature is rated across five numerical dimensions, enabling businesses to prioritize development efforts effectively:
Revenue Boost
Cost Reduction
Customer Acquisition
Customer Retention
Customer Satisfaction
By leveraging Feature Gap Analysis, businesses can make informed investment decisions, enhance their product-market fit, and drive customer engagement and growth
UXI (User Experience Investigation) is a UI/UX audit framework that evaluates core business pages with unparalleled depth, powered by ImpelHub Audit. Unlike standard audits, ImpelHub leverages Business Brain, ensuring that recommendations are contextually aligned with the company’s strategy, market position, and growth objectives.
Key Audit Components:
Feature & Objective – Identifies key UI/UX elements and their purpose.
Details & Justification – Explains audit findings in a business-relevant manner.
Impact & Area – Evaluates influence on user experience.
Rationale – Context-driven reasoning for suggested improvements.
Impact-Driven Scoring Mechanism
Each UI/UX strategy is numerically rated across five dimensions, helping decision-makers prioritize investments:
Revenue Boost
Cost Reduction
Customer Acquisition
Customer Retention
Customer Satisfaction
This data-driven scoring allows businesses to allocate resources effectively, ensuring maximum ROI on UI/UX improvements and driving sustained growth
Detailed Execution Blueprint is a task list and project roadmap that breaks down high-level strategies into step-by-step, week-by-week execution plans, ready for team assignment and implementation.
Key Features:
Detailed Task Breakdown – Converts strategies into actionable steps.
Week-by-Week Execution Timeline – Ensures structured and phased implementation.
Team Assignments – Each plan is ready to be assigned to the relevant team for execution.
Operational Clarity & Accountability – Provides a clear roadmap to track progress.
By leveraging Launch-Detailed Plan, businesses can ensure smooth execution, improve efficiency, and drive successful implementation
FanScope is an extensive catalog of potential buyer types, both direct and indirect, categorized using 10 key attributes. It helps decision-makers identify, evaluate, and include or exclude buyer types before the segmentation process.
As the first step toward segmentation, FanScope informs:
ICP (Ideal Customer Profile) Definitions
Persona Development
Firmographics (B2B segmentation)
ICP Scoring
By analyzing buyer roles, revenue segments, pain points, and purchase probabilities, FanScope enables businesses to refine their target audience, optimize resource allocation, and improve sales and marketing efficiency.
The Segmentation Module refines customer targeting through Rated ICPs, Personas, and Firmographics (B2B). Each ICP is assessed across 22 attributes, covering:
Profile & Behavior – Segment, characteristics, decision-makers, and buying behavior.
Business Fit – Pain points, goals, product needs, and purchase drivers.
Engagement Factors – Technology, content consumption, marketing channels, and objections.
Strategic Insights – Value proposition, competition, and customer service needs.
ICP Scoring rates each profile on 10 numerical dimensions, helping decision-makers quickly prioritize the best targets for sales and marketing strategies
FoeScope is a competitive analysis framework that identifies and evaluates competitors across three revenue segments—small, medium, and large—relative to the business’s revenue. It assesses competitors based on:
Key Products/Services – Most similar offerings.
Geography – Market overlap.
Target Audience – Shared customer base.
Similarity Score & Reasoning – Measures alignment with the business.
FoeScope serves as a precursor to CounterEdge, laying the groundwork for deeper competitive strategy development by helping businesses identify and categorize their most relevant competitors
CounterEdge analyzes competitor growth strategies, their impact on the client’s business, and countermeasures to stay competitive. It evaluates:
Competitor Strength & Market Impact – Key advantages and threat level.
Affected Business Touchpoints – Areas influenced by competition.
Adaptation Strategy – Actionable countermeasures.
Impact Grade & Rationale – Severity of threat (1-5).
Potential Business Benefits – Strategic opportunities.
By leveraging CounterEdge, businesses can anticipate threats, mitigate risks, and implement winning strategies.
NextMove is a growth strategy framework designed to help businesses identify, evaluate, and implement high-impact strategies. Each strategy is numerically rated across 10 dimensions, similar to ICP Rating, allowing decision-makers to prioritize the most effective paths for expansion.
Key Assessment Areas:
Strategy Type, Objective & Target Audience – Defines the approach, aligns with Ideal Customer Profiles (ICPs), and ensures relevance to market needs.
Key Tactics & Content Marketing – Outlines the execution plan, including marketing initiatives to drive engagement.
Required Resources & Risk Assessment – Identifies necessary investments, potential risks, and feasibility.
Timeline & Measurement Metrics – Provides a structured roadmap for execution and tracking success.
Relevance (%) & Potential Impact – Scores strategies based on alignment with business goals, market trends, and competitive landscape.
By leveraging NextMove, businesses gain a data-driven approach to strategic growth, enabling them to quickly assess and implement the most effective strategies for scalability, market expansion, and long-term success.
GTM/Scale Up Playbook creates high-level execution plans for selected growth strategies, ensuring effective implementation. It prioritizes strategies based on impact, feasibility, and alignment with business objectives.
Key Components:
Phases – Defines the execution stage.
Strategy Score – Numerical rating for prioritization.
Strategy Suggestions & Rationale – Recommended actions with justification.
Highlights – Key takeaways and strategic advantages.
Related Strategy – Links to complementary approaches.
Targeted ICPs (ICP Phase) – Aligns execution with the right customer segments.
By leveraging GTM/Scale Up Playbook, businesses can streamline execution, focus on high-impact strategies, and drive measurable growth.
Insight360 is a key component of the “Your Business” pillar within the Business Brain/Context framework. It delivers data-driven insights across 9 key categories, covering 40+ critical business aspects, including market positioning, competitive landscape, revenue analysis, industry trends, and brand identity.
These insights drive two strategic outputs:
Custom Growth Strategies – Tailored plans developed with AI, Impelian, Impelist, and human expertise to support business expansion and address key challenges.
Contextual UI/UX Audit – Identifies feature gaps and aligns product offerings with market needs.
Insight360 provides a multidimensional understanding of the business, industry, and competitive landscape. By leveraging these insights, businesses can optimize market positioning, enhance customer engagement, and accelerate growth.
Insight360+ enhances Insight360 by analyzing a business at a deeper level through 15 additional dimensions. It provides a self-reflective framework to uncover strategic opportunities in:
Sales & Revenue Optimization – Pricing models, sales processes, and client strategies.
Market & Digital Presence – Online marketing, industry positioning, and partnerships.
Innovation & Technology – AI /Tech integration and product/service development.
With Insight360+, businesses gain a more comprehensive perspective to refine strategies, strengthen market positioning, and drive sustainable growth.
Founder & CEO

Co-Founder & Chief Revenue Officer
Please enter your email to download the Sample Score Card.
Please enter your email to download the playbook.
Unlock exclusive tools for growth