Posted by Gigi J.K
in Ai
in Ai
Most companies don’t struggle with growth because they lack data. Because they monitor the incorrect metrics for their stage, they have difficulties.
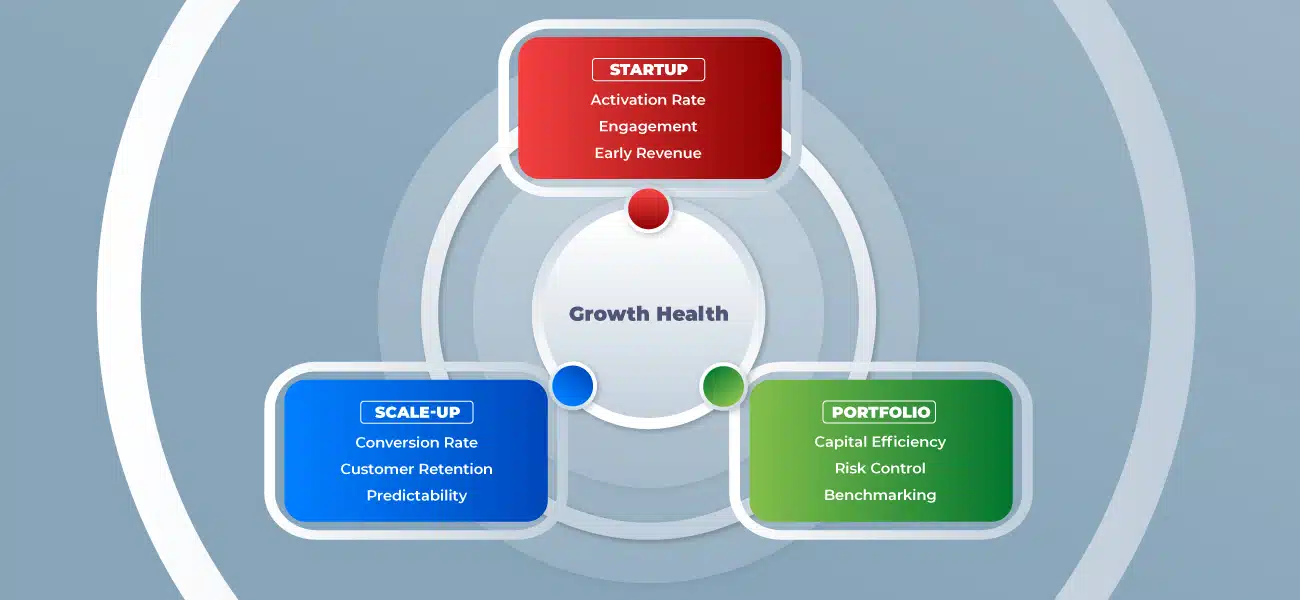
Startups in their early stages require analytics that demonstrate actual demand and usage. Scale-ups require measurements that demonstrate predictability and repeatability. Metrics that demonstrate effectiveness, risk, and comparability are essential for portfolio companies.
Teams that use the same metrics throughout stages end up making bad choices, misinterpreting progress, and wasting time discussing dashboards rather than taking action. Keeping track of fewer, stage-appropriate indicators enables leaders to advance confidently, identify issues early, and align quickly.
Growth metrics are supposed to create clarity.
In reality, they often do the opposite.
Founders argue over dashboards.
Marketing celebrates numbers that sales don’t trust.
Finance worries about burn while growth teams chase momentum.
Investors ask questions that metrics don’t clearly answer.
The problem usually isn’t a lack of data.
It’s tracking the wrong metrics for the stage you’re actually in.
What matters at an early startup is often dangerous at scale.
What works for a scale-up can mislead a portfolio company.
And metrics that look impressive in isolation often hide real risk.
This article breaks down which growth metrics actually matter by stage and, more importantly, why different leaders care about different signals as companies evolve.
Every company goes through phases, whether formally labeled or not.
Early on, the goal is proof.
Later, it’s repeatability.
Eventually, it’s efficiency and predictability.
The mistake many teams make is carrying the same metrics forward, long after they’ve stopped being useful.
The right metrics should:
Let’s break this down by stage.
At the startup stage, the biggest question is simple:
Is there real demand here, or are we just busy?
Product teams, early growth leaders, and founders are attempting to demonstrate that the issue is genuine and that consumers are interested enough to interact, make a purchase, or come back.
At this point, volume matters far less than signal quality.
What tends to matter most:
For founders and CEOs, these metrics answer:
“Are we building something people genuinely want?”
For product leaders, they answer:
“Are users getting value quickly?”
For growth and marketing leaders, they help separate real traction from noise.
What doesn’t matter yet:
Trying to optimize too early often leads teams to scale something fragile.
Once a company has proven demand, the question changes:
Can this growth be repeated without breaking the system?
This is where many companies stumble. Early traction looks promising, but results become inconsistent as spend increases or teams grow.
At this stage, CROs, CMOs, and heads of growth become deeply focused on reliability.
Now the focus shifts from “does it work?” to “does it work consistently?”
Key signals include:
For revenue leaders, these metrics help identify where growth is leaking.
For marketing leaders, they separate channels that drive demand from those that merely generate activity.
For finance teams, they begin to answer:
“Is growth worth the cost?”
This is also where alignment becomes critical. When teams track different definitions of success, scale amplifies confusion instead of results.
Portfolio companies introduce a different challenge entirely.
Here, the question is no longer just about growth, it’s about comparability and risk.
Portfolio managers, operating partners, and investors need to understand:
Portfolio metrics must be:
This often includes:
For portfolio leaders, metrics aren’t about optimization.
They’re about prioritization.
Which companies deserve more support?
Which needs course correction?
Which look good on paper but are fragile underneath?

One reason growth metrics cause friction is that different roles use them for different decisions.
A founder looks for confidence and direction.
A CRO looks for revenue reliability.
A CMO looks for demand quality.
A CFO looks for efficiency and runway.
An investor looks for risk signals.
When metrics are not stage-appropriate, leaders talk past each other.
The right metrics do something powerful:
They align decisions across roles, without forcing everyone to think the same way.
Most teams don’t suffer from too few metrics.
They suffer from too many low-impact ones.
Dashboards grow.
Reporting expands.
Meetings get longer.
But decisions don’t get clearer.
High-performing teams consistently do one thing well:
They track fewer metrics, more intentionally, and revisit them as the business evolves.
This saves:
A metric that doesn’t change behavior is just a number.
The best growth metrics:
This is why stage awareness matters so much.
What signals confidence at one stage can signal risk at another.
When teams track the right metrics for their stage:
Growth stops feeling chaotic and starts feeling intentional.
This is not about perfection.
It’s about directional confidence.
Growth metrics are meant to help leaders think clearly.
When chosen well, they:
When chosen poorly, they:
The biggest advantage growing companies can give themselves is not more data, but better signals, matched to the stage they’re in.
That is how startups grow into scale-ups.
That is how scale-ups become durable companies.
And that is how portfolios manage risk without losing momentum.
Instead of following a set schedule, growth measures should be examined whenever the business undergoes a significant transition. Metrics may need to change in response to signals such as fresh funding, a change in price, a new GTM move, or an ICP shift. One of the quickest ways to misinterpret progress is to stick with the same measurements for too long.
If teams are hitting targets but leaders still feel uneasy about growth, that’s a major warning sign. Another red flag is constant debate around dashboards without clear decisions coming out of them. Metrics should reduce uncertainty, not create more discussion.
Investor metrics are useful for communication, but operating metrics are what drive decisions. The most successful businesses keep the two distinct: they monitor a more manageable set of internal performance indicators and convert them into updates that are appealing to investors. Long-term health is frequently subordinated to short-term optics when teams are solely focused on investment metrics.
Yes. The improper conduct is frequently encouraged by the wrong measures. For instance, focusing too much on efficiency too soon might impede progress, while emphasizing top-line growth without considering efficiency will burn runway. Since metrics influence behavior, misaligned metrics have the potential to subtly steer teams in the incorrect direction.
Most high-performing teams track fewer than 10 core growth metrics at any given stage. Everything else is supporting data. If your team is actively watching dozens of metrics, it usually means priorities are unclear. Clarity improves when the number of “decision-driving” metrics goes down.
2 combos (1 competitor × 2 dimensions)
20 combos $5 per additional combo
100 combos $4 per additional combo
280 combos $3 per additional combo

7 Steps / 8 – 10 days / 2 – 3 hours of your time
Maximize your impact with ImpelHub’s Growth Lever Identifier—our AI-powered system that discovers your single biggest growth lever and accelerates your success. By analyzing your revenue streams, marketing channels, and core metrics, it highlights the most effective path to scalable growth and pinpoints your highest-ROI strategy, so you can focus on what truly matters, multiply your revenue, and stay ahead in today’s competitive market. Our clear, data-driven action plan ensures you can scale faster and more efficiently than ever.
Insight360, part of the “Your Business” pillar in the Business Brain/Context framework, delivers data-driven insights across 9 categories and 40+ business aspects, including market positioning, competition, revenue, trends, and brand identity.
It drives two key outputs:
With a multidimensional business view, Insight360 helps optimize positioning, enhance engagement, and accelerate growth.
Insight360+ expands on Insight360 with 15 additional dimensions, offering a deeper analysis of business strategy. It provides a self-reflective framework to uncover opportunities in:
With Insight360+, businesses refine strategies, strengthen positioning, and drive sustainable growth.
FanScope is a comprehensive catalog of buyer types, categorized by 10 key attributes, helping decision-makers assess and refine target audiences before segmentation.
As the first step in segmentation, FanScope informs:
By analyzing buyer roles, revenue segments, and purchase probabilities, FanScope enhances targeting, optimizes resources, and improves sales and marketing efficiency.
The Segmentation Module enhances customer targeting with Rated ICPs, Personas, and Firmographics (B2B), assessing each ICP across 22 attributes, including:
ICP Scoring evaluates profiles on 10 numerical dimensions, enabling businesses to prioritize high-value targets efficiently.
FoeScope is a competitive analysis framework that evaluates competitors across three revenue segments—small, medium, and large—relative to the business’s revenue. It assesses:
As a precursor to CounterEdge, FoeScope helps businesses identify and categorize key competitors, setting the stage for deeper competitive strategy development.
CounterEdge analyzes competitor growth strategies, their impact on the business, and countermeasures to stay competitive. It evaluates:
By leveraging CounterEdge, businesses can anticipate threats, mitigate risks, and implement winning strategies.
NextMove is a growth strategy framework that helps businesses identify, evaluate, and implement high-impact strategies. Each strategy is numerically rated across 10 dimensions, similar to ICP Rating, to prioritize the most effective paths for expansion.
With NextMove, businesses gain a data-driven approach to strategic growth, ensuring scalability, market expansion, and long-term success.
Launch-Execution Blueprint creates high-level execution plans for growth strategies, prioritizing them based on impact, feasibility, and business alignment.
By leveraging Launch-Execution Blueprint, businesses can streamline execution, focus on high-impact strategies, and drive measurable growth.
Maximize your impact with ImpelHub’s AI-powered Growth Lever Identifier. By analyzing revenue streams, marketing channels, and core metrics, it uncovers your biggest growth lever and highest-ROI strategy.
With a clear, data-driven action plan, you can focus on what matters, scale faster, and stay ahead in today’s competitive market.
Maximize your impact with ImpelHub’s Growth Lever Identifier—our AI-powered system that discovers your single biggest growth lever and accelerates your success. By analyzing your revenue streams, marketing channels, and core metrics, it highlights the most effective path to scalable growth and pinpoints your highest-ROI strategy, so you can focus on what truly matters, multiply your revenue, and stay ahead in today’s competitive market. Our clear, data-driven action plan ensures you can scale faster and more efficiently than ever.
Feature Gap Analysis is a powerful tool within ImpelHub that identifies missing or desired features based on the needs and expectations of the target audience. By leveraging Business Brain, it ensures that feature recommendations are strategically aligned with business goals and market demand.
Key Benefits:
Identifies Missing Features – Pinpoints gaps in the product or service offering.
Aligns with Target Audience Needs – Ensures features meet user expectations.
Prioritization via Impact Scoring – Helps decision-makers invest wisely.
Data-Driven Scoring Mechanism
Each feature is rated across five numerical dimensions, enabling businesses to prioritize development efforts effectively:
Revenue Boost
Cost Reduction
Customer Acquisition
Customer Retention
Customer Satisfaction
By leveraging Feature Gap Analysis, businesses can make informed investment decisions, enhance their product-market fit, and drive customer engagement and growth
UXI (User Experience Investigation) is a UI/UX audit framework that evaluates core business pages with unparalleled depth, powered by ImpelHub Audit. Unlike standard audits, ImpelHub leverages Business Brain, ensuring that recommendations are contextually aligned with the company’s strategy, market position, and growth objectives.
Key Audit Components:
Feature & Objective – Identifies key UI/UX elements and their purpose.
Details & Justification – Explains audit findings in a business-relevant manner.
Impact & Area – Evaluates influence on user experience.
Rationale – Context-driven reasoning for suggested improvements.
Impact-Driven Scoring Mechanism
Each UI/UX strategy is numerically rated across five dimensions, helping decision-makers prioritize investments:
Revenue Boost
Cost Reduction
Customer Acquisition
Customer Retention
Customer Satisfaction
This data-driven scoring allows businesses to allocate resources effectively, ensuring maximum ROI on UI/UX improvements and driving sustained growth
Detailed Execution Blueprint is a task list and project roadmap that breaks down high-level strategies into step-by-step, week-by-week execution plans, ready for team assignment and implementation.
Key Features:
Detailed Task Breakdown – Converts strategies into actionable steps.
Week-by-Week Execution Timeline – Ensures structured and phased implementation.
Team Assignments – Each plan is ready to be assigned to the relevant team for execution.
Operational Clarity & Accountability – Provides a clear roadmap to track progress.
By leveraging Launch-Detailed Plan, businesses can ensure smooth execution, improve efficiency, and drive successful implementation
FanScope is an extensive catalog of potential buyer types, both direct and indirect, categorized using 10 key attributes. It helps decision-makers identify, evaluate, and include or exclude buyer types before the segmentation process.
As the first step toward segmentation, FanScope informs:
ICP (Ideal Customer Profile) Definitions
Persona Development
Firmographics (B2B segmentation)
ICP Scoring
By analyzing buyer roles, revenue segments, pain points, and purchase probabilities, FanScope enables businesses to refine their target audience, optimize resource allocation, and improve sales and marketing efficiency.
The Segmentation Module refines customer targeting through Rated ICPs, Personas, and Firmographics (B2B). Each ICP is assessed across 22 attributes, covering:
Profile & Behavior – Segment, characteristics, decision-makers, and buying behavior.
Business Fit – Pain points, goals, product needs, and purchase drivers.
Engagement Factors – Technology, content consumption, marketing channels, and objections.
Strategic Insights – Value proposition, competition, and customer service needs.
ICP Scoring rates each profile on 10 numerical dimensions, helping decision-makers quickly prioritize the best targets for sales and marketing strategies
FoeScope is a competitive analysis framework that identifies and evaluates competitors across three revenue segments—small, medium, and large—relative to the business’s revenue. It assesses competitors based on:
Key Products/Services – Most similar offerings.
Geography – Market overlap.
Target Audience – Shared customer base.
Similarity Score & Reasoning – Measures alignment with the business.
FoeScope serves as a precursor to CounterEdge, laying the groundwork for deeper competitive strategy development by helping businesses identify and categorize their most relevant competitors
CounterEdge analyzes competitor growth strategies, their impact on the client’s business, and countermeasures to stay competitive. It evaluates:
Competitor Strength & Market Impact – Key advantages and threat level.
Affected Business Touchpoints – Areas influenced by competition.
Adaptation Strategy – Actionable countermeasures.
Impact Grade & Rationale – Severity of threat (1-5).
Potential Business Benefits – Strategic opportunities.
By leveraging CounterEdge, businesses can anticipate threats, mitigate risks, and implement winning strategies.
NextMove is a growth strategy framework designed to help businesses identify, evaluate, and implement high-impact strategies. Each strategy is numerically rated across 10 dimensions, similar to ICP Rating, allowing decision-makers to prioritize the most effective paths for expansion.
Key Assessment Areas:
Strategy Type, Objective & Target Audience – Defines the approach, aligns with Ideal Customer Profiles (ICPs), and ensures relevance to market needs.
Key Tactics & Content Marketing – Outlines the execution plan, including marketing initiatives to drive engagement.
Required Resources & Risk Assessment – Identifies necessary investments, potential risks, and feasibility.
Timeline & Measurement Metrics – Provides a structured roadmap for execution and tracking success.
Relevance (%) & Potential Impact – Scores strategies based on alignment with business goals, market trends, and competitive landscape.
By leveraging NextMove, businesses gain a data-driven approach to strategic growth, enabling them to quickly assess and implement the most effective strategies for scalability, market expansion, and long-term success.
GTM/Scale Up Playbook creates high-level execution plans for selected growth strategies, ensuring effective implementation. It prioritizes strategies based on impact, feasibility, and alignment with business objectives.
Key Components:
Phases – Defines the execution stage.
Strategy Score – Numerical rating for prioritization.
Strategy Suggestions & Rationale – Recommended actions with justification.
Highlights – Key takeaways and strategic advantages.
Related Strategy – Links to complementary approaches.
Targeted ICPs (ICP Phase) – Aligns execution with the right customer segments.
By leveraging GTM/Scale Up Playbook, businesses can streamline execution, focus on high-impact strategies, and drive measurable growth.
Insight360 is a key component of the “Your Business” pillar within the Business Brain/Context framework. It delivers data-driven insights across 9 key categories, covering 40+ critical business aspects, including market positioning, competitive landscape, revenue analysis, industry trends, and brand identity.
These insights drive two strategic outputs:
Custom Growth Strategies – Tailored plans developed with AI, Impelian, Impelist, and human expertise to support business expansion and address key challenges.
Contextual UI/UX Audit – Identifies feature gaps and aligns product offerings with market needs.
Insight360 provides a multidimensional understanding of the business, industry, and competitive landscape. By leveraging these insights, businesses can optimize market positioning, enhance customer engagement, and accelerate growth.
Insight360+ enhances Insight360 by analyzing a business at a deeper level through 15 additional dimensions. It provides a self-reflective framework to uncover strategic opportunities in:
Sales & Revenue Optimization – Pricing models, sales processes, and client strategies.
Market & Digital Presence – Online marketing, industry positioning, and partnerships.
Innovation & Technology – AI /Tech integration and product/service development.
With Insight360+, businesses gain a more comprehensive perspective to refine strategies, strengthen market positioning, and drive sustainable growth.

Founder & CEO

Co-Founder & Chief Revenue Officer
Please enter your email to download the Sample Score Card.
Please enter your email to download the playbook.
Unlock exclusive tools for growth