in Ai, AI and Personal Growth, AI in the Workplace, AI-powered Business Operations, Business Growth, Business Intelligence, Technology

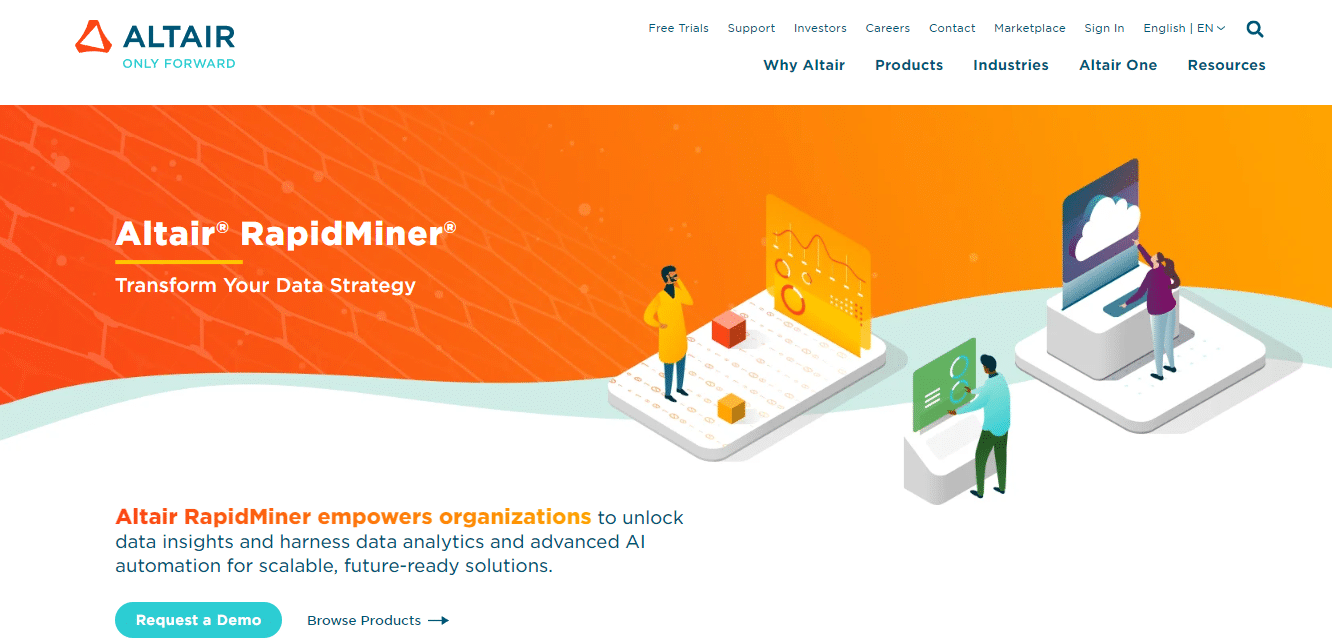
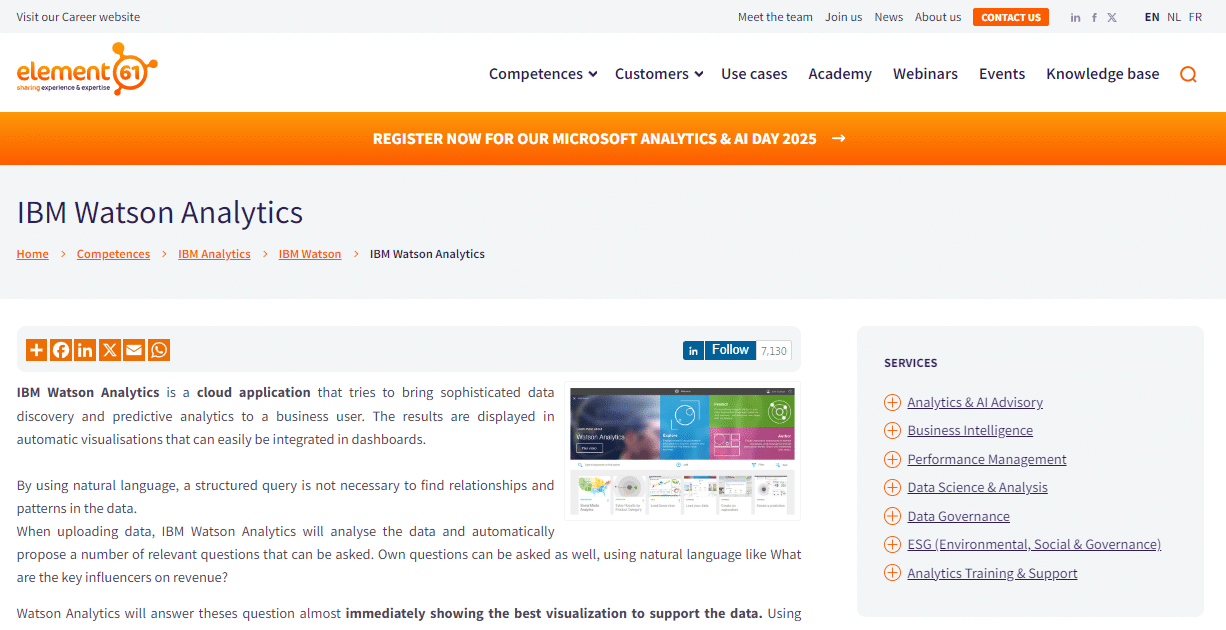
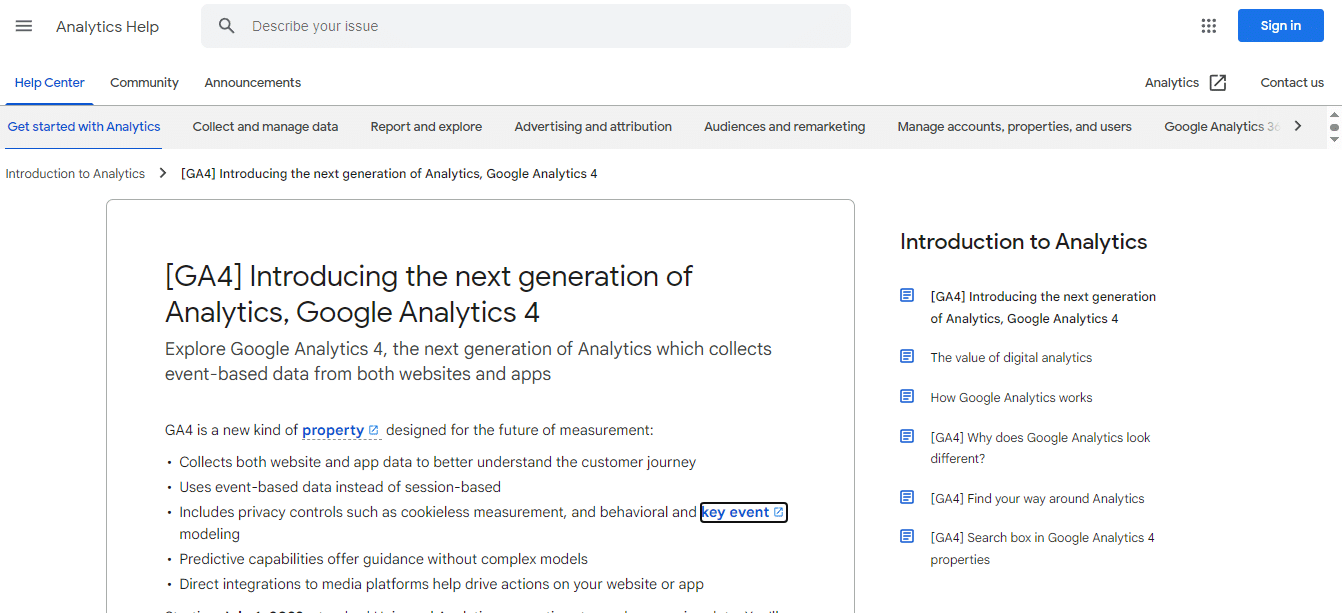
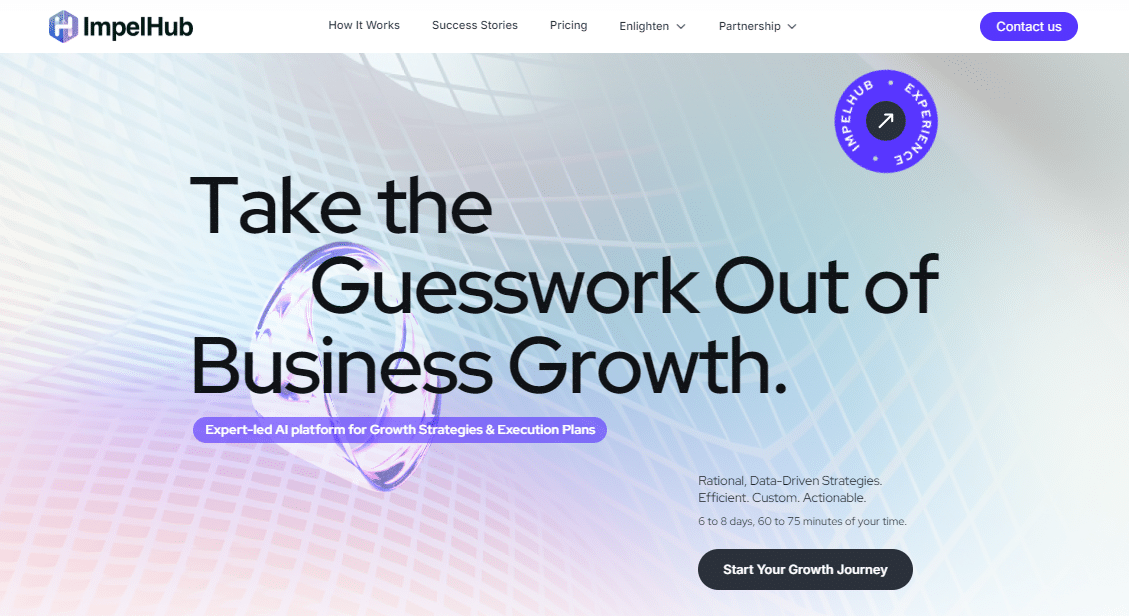
Want to make smarter business decisions faster? Companies often struggle to process vast amounts of information quickly enough to make effective decisions. This is where AI analytics tools emerge—transforming raw data into meaningful insights, uncovering trends, predicting outcomes, and empowering businesses to act confidently.
By leveraging these advanced tools, businesses can enhance productivity by 15% to 40%, streamline decision-making, and gain a competitive edge. Whether you are looking to optimize operations, understand customer behavior, or forecast market trends, AI analytics tools can help you turn data into your most valuable asset.
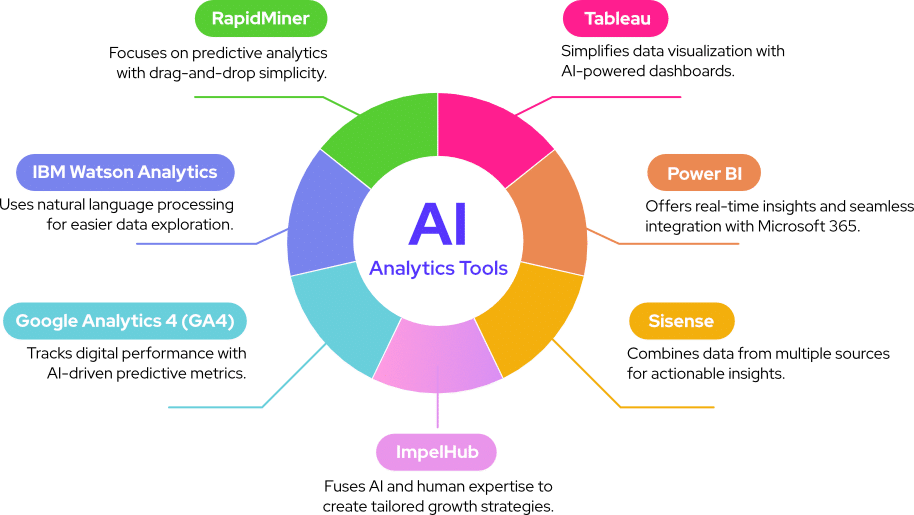
This blog will discuss 7 AI analytics tools to process data efficiently, uncover trends, and predict outcomes.

Table of Contents
Use ImpelHub’s AI platform to combine your customer segmentation and competitor analysis capabilities
Comparison of Leading Data Analytics Tools: Features, Pricing, and Best Use Cases
Tool | Key Features | Pricing (USD) | Best For |
Tableau | AI visualizations, natural language | $15–$75/user/month | Data visualization |
Power BI | Real-time insights, 500+ data sources | Free–$20/user/month | Business intelligence |
Sisense | AI-driven insights, interactive dashboards | Custom pricing | Advanced analytics |
RapidMiner | Predictive modeling, no coding needed | Custom pricing | Predictive analytics |
IBM Watson | NLP, automated visualizations | Custom pricing | Simplified data analysis |
GA4 | Event-based tracking, privacy-focused | Free | Digital performance metrics |
ImpelHub | Modular intelligence, growth strategies | Custom pricing | Tailored business planning |
These tools are transforming industries by delivering faster insights and better decisions.
Let us dive into the full article for detailed features, pricing, and success stories.

Tableau simplifies complex data, helping businesses make smarter decisions. Companies using Tableau report a 33% boost in insights-driven decisions, highlighting its essential role for organizations aiming to grow through data
The platform combines an easy-to-use interface with AI-powered visual analytics. Thanks to its drag-and-drop VizQL technology, teams can analyze data effortlessly. Tableau also adds business context to analytics, making it easier to identify important patterns.
Real-World Success Stories
Here’s how Tableau is making a difference across various industries:
“We believe data analysis should be about asking questions and not about learning software. With built-in visual best practices, Tableau provides limitless data exploration without interrupting your flow of analysis. That’s why people love using Tableau.” – Tableau US
- HelloFresh: Centralized digital marketing reporting, saving 10–20 hours daily. This freed up time to create three buyer personas and launch targeted campaigns by region
- REI: Processed over 90 terabytes of co-op membership data to guide decisions on retail versus digital investments [4].
- Coca-Cola Bottling Company: Saved over 260 hours annually by automating reporting. Sales teams now access real-time CRM data through mobile dashboards
- Chipotle Mexican Grill Tripled its reporting speed, moving from quarterly to monthly insights, which saved thousands of hours
Key Features
- Interactive Visualizations: Create dynamic charts, graphs, and dashboards that can be easily customized.
- Data Connectivity: Connects to various data sources, including Excel, SQL Server, Google Sheets, and cloud-based databases.
- AI and NLP Capabilities: Use “Ask Data” to query data using natural language, simplifying the analysis process.
- Real-Time Data Analysis: Access and analyze real-time data for timely decision-making.
- Collaborative Sharing: Share insights securely across teams or stakeholders.
Use Cases
- Business intelligence for executive decision-making.
- Market analysis to identify trends and patterns.
- Financial analytics for budgeting and forecasting.
- Sales performance tracking and customer segmentation.
Pricing Options
Tableau offers three plans to fit different needs:
Plan Type | Monthly Cost* | Best For |
Creator | $75 | Advanced analytics users |
Explorer | $42 | Data exploration needs |
Viewer | $15 | Basic reporting access |
*Prices are per user and billed annually
Whether saving time, improving efficiency, or speeding up insights, Tableau proves its value across industries.

Power BI simplifies complex data, delivering clear insights with the help of AI-driven analytics. According to a Forrester Consulting study, companies that combined Power BI with Microsoft 365 saw a 321% return on investment within three years and recovered their costs in under six months
Enterprise-Grade Features
Power BI stands out with its impressive data capabilities:
- Extensive Connectivity: Access over 500 data sources, whether cloud-based or on-premises
- Massive Data Handling: Process petabytes of data with enterprise-level ingestion
- Real-Time Analytics: Tap into live insights by connecting directly to streaming and real-time data
- AI-Driven Insights: Use AI tools to create instant reports and uncover patterns automatically.
These features make it easy to integrate Power BI into existing business systems.
Business Impact Through Integration
Power BI’s integration with Microsoft’s ecosystem takes its utility to another level.
Mike Abram, Chief Information Officer at Westinghouse Electric Company, said, “When we adopted Microsoft 365, Power BI immediately demonstrated that it could provide robust data experiences integrated into the tools people already use every day.”
According to Anthony Reed, Foods Data Product Manager at Marks & Spencer, “Having all of our data in one single place… has allowed us to build dashboards… helping improve the speed to insight quickly.”
Pricing Plans: Features and Monthly Costs
Plan | Monthly Cost | Features |
Free | $0 | Interactive reports, visual analytics |
Pro | $10/user | Collaboration and sharing capabilities |
Premium Per User | $20/user | Advanced AI tools and support for larger datasets |
All prices are in USD, billed monthly
Performance Optimization
To get the best results from Power BI:
- Use a Star schema to speed up queries.
- Keep reports and data sources in the same region.
- Simplify dashboards by reducing unnecessary visuals.
Lars Hesse, Data Analyst at E.ON Energie Deutschland GmbH said, “Power BI had a clear advantage over other tools in terms of interoperability with the Microsoft 365 platform. We face no obstacles in getting data to the right place.”

Sisense’s all-in-one analytics platform turns data into actionable insights. It simplifies data processing while delivering powerful analytical tools
Core Analytics Features of Sisense: Processes, Capabilities, and Business Impact
Process | Capability | Business Impact |
Data Modeling | 400+ data connectors | Combines data from multiple sources |
Analysis | AI-powered exploration | Automatically detects patterns |
Visualization | Interactive dashboards | Supports real-time decisions |
Real-World Performance Impact
Organizations using Sisense report significant operational improvements. For example, USA Swimming now delivers insights 20x faster to its 400,000 users, transforming how coaches and athletes access performance data.
As rightly quoted by Patrick Murphy, Senior Director of Data and Product at USA Swimming, “We’re trying to enable our teams and coaches around the country to think in new ways and to look at data in different ways, and Sisense is helping us to do that.”
AI-Driven Insights
Sisense takes decision-making further by integrating AI. Its AI-driven tools is known for the below features.
- Automated Explanations: Pinpoints the factors driving data changes by analyzing hundreds of variables
- Conversational Analytics: Lets users explore data with natural language queries
Business Transformation Examples
Sisense has helped businesses achieve impressive results. Funraise, for instance, saw:
- 40 hours saved weekly
- 7x increase in fundraising
- 12% boost in donor retention
Tony Sasso, Chief Product Officer at Funraise, explained, “Now that we’ve built the dashboards and templates with Sisense, nonprofits can simply check our library for the report template they need, and they’re off and running.”
Security and Scalability
Sisense combines strong security with fast deployment.
Devin Vyain, Senior Solutions Architect at Barrios, highlighted this balance: “We went from custom application development to rapidly updating dashboards in real-time while maintaining robust security. That helped us level up.”
This mix of security and flexibility makes Sisense a smart choice for organizations managing sensitive data that need quick, actionable insights.

RapidMiner is a robust platform simplifying predictive analytics, helping businesses make informed, data-driven decisions. It handles everything from data preparation to machine learning, predictive modeling, and deployment. Its drag-and-drop interface makes it easy for teams to create predictive models without writing code, opening up advanced analytics to a wide range of users
RapidMiner: Key Features and Benefits
Feature | Function | Business Use |
Data Preparation | Automates cleaning and transformation | Speeds up data readiness |
Machine Learning | Offers various algorithms | Builds diverse prediction models |
Model Deployment | Real-time and batch predictions | Enables fast implementation |
Performance Monitoring | Tracks model accuracy | Ensures continuous improvement |
Seamless Integration with Enterprise Systems
RapidMiner works smoothly with enterprise systems like Oracle and SAP, creating a cohesive data environment. This allows businesses to analyze unstructured data, automate repetitive tasks, and deploy AI-driven predictions.
Practical Application Example
Mabe, a top appliance manufacturer, used RapidMiner to predict consumer behavior and enhance refrigerator performance. This led to better energy efficiency and longer food freshness, showcasing how predictive analytics can directly improve products and customer satisfaction.
Insights from Users
A Senior Software Engineer shared their experience with RapidMiner, “RapidMiner streamlines our entire process – from data preparation to analysis – enabling swift, informed decisions.”
Automation and AI Capabilities
RapidMiner takes automation to the next level by extracting data from unstructured reports and using AI to monitor processes and predict trends. It supports a range of machine learning algorithms, such as decision trees, logistic regression, and neural networks, making it a versatile tool for tackling complex business problems.

IBM Watson Analytics is a cloud-based tool that simplifies complex data analysis. It uses natural language processing and predictive tools to make advanced analytics easier for business users to access and utilize effectively
Key Analytics Features of IBM Watson Analytics
Feature | What It Does | How It Helps Businesses |
Natural Language Processing | Understands plain English questions | Removes the need for technical query skills |
Automated Visualization | Recommends the best ways to present data | Speeds up the process of finding insights |
Predictive Analysis | Detects behavior patterns | Helps businesses make proactive decisions |
Data Refinement | Combines data from multiple sources | Enables deeper and more thorough analysis |
Automated Intelligence Tools
Watson Studio, a core part of Watson Analytics, reduces the effort needed for monitoring models by 35–50% and improves accuracy by 15–30%. Its AutoAI feature handles tasks like data cleaning, building models, feature engineering, and fine-tuning parameters automatically.
Seamless Enterprise Integration
Watson Analytics is designed to work well with enterprise systems. Its Enterprise edition offers flexible connectivity options, making it easy to integrate with:
- Databases
- ERP platforms
- Reporting tools
- Cloud services
- On-premise systems
Practical Uses in Business
“Business analytics is the statistical methods and computing technologies for processing, mining, and visualizing data to uncover patterns, relationships, and insights that enable better business decision-making.” — IBM
This platform is used across departments like finance and marketing to improve revenue forecasts and allocate resources more efficiently based on performance metrics
Focus on Governance and Security
Watson Analytics prioritizes responsible AI use with its built-in governance tools. It supports automated monitoring and can process queries in over 20 languages. These features ensure compliance, accuracy, and accessibility for business users.

Google Analytics 4 (GA4) changes how businesses analyze digital performance by combining website and app data into one platform. It uses an event-based tracking system to understand customer behavior and engagement better. With AI integration, GA4 also introduces tools for predictive analytics, helping businesses make smarter decisions.
AI-Driven Features of Google Analytics for Enhanced Business Insights
Feature | Business Use | How It Helps |
Predictive Audiences | Groups users based on likely actions | Enables precise marketing and retention strategies |
Predictive Metrics | Predicts future customer behaviors | Helps businesses stay ahead of market trends |
Channel Value Analysis | Evaluate marketing channel performance | Guides better resource distribution for customer acquisition |
Behavioral Modeling | Studies user behavior while respecting privacy | Delivers insights without compromising privacy rules |
Key Performance Metrics
GA4 tracks essential metrics like engagement rate and the number of engaged sessions divided by total sessions. An engaged session is defined as one that lasts more than 10 seconds, includes a conversion event, or involves two or more page or screen views.
Advanced Privacy Features
GA4 tracks essential metrics like engagement rate and the number of engaged sessions divided by total sessions. An engaged session is defined as one that lasts more than 10 seconds, includes a conversion event, or involves two or more page or screen views.
How It Is Achieved
- Cookieless Tracking: GA4 uses advanced machine learning techniques to fill in data gaps when cookies are unavailable, ensuring insights remain accurate.
- Privacy-Conscious Behavioral Modeling: GA4 anonymizes and aggregates user data, reducing the need for personally identifiable information (PII) while providing meaningful behavioral insights.
These features allow businesses to gain insights while respecting user privacy, enhancing the platform’s predictive abilities.
Strategic Implementation
“These tools are not just about data analysis; they’re about foresight and strategy, enabling businesses to make more informed decisions.” Andrew C. Author.
Practical Business Uses
GA4 proves helpful in several areas, including:
- Revenue Tracking: Monitor total revenue, customer lifetime value, and conversion data.
- User Engagement Analysis: Measure average engagement time and track events or views for deeper insights.
- Marketing Performance: Assess ad clicks, monitor conversion rates, and evaluate acquisition channels.
Professional Growth Opportunities
GA4 doesn’t just deliver data – it also helps teams grow their skills. The platform offers training courses for all levels, from beginner to advanced, ensuring teams can fully utilize its strategic, data-driven planning tools.

ImpelHub combines AI-powered analytics with human expertise to help businesses develop smarter growth strategies quickly. With just 60 minutes of input, it can create a tailored AI-driven business framework in 6-8 days.
Modular Intelligence System
ImpelHub’s system is divided into specialized modules designed to address key business needs.
Module | Purpose | Key Benefits |
Insight360 | Business Overview Analysis | Pinpoints major growth opportunities |
FanScope | Customer Behavior Analysis | Develops detailed customer profiles |
FoeScope | Competitive Intelligence | Uncovers strategies for market positioning |
NextMove | Strategy Development | Creates actionable growth plans |
UxI | Interface Analysis | Offers insights to improve UI/UX |
Real-World Impact
Healthcare Sector Recovery
Due to algorithm changes, TreatLyme, a healthcare company, faced a 40% revenue drop. By using ImpelHub’s strategies, they achieved:
- Stabilized revenue
- Improved website traffic metrics
- Established a foundation for scalable growth
Automotive Industry Shift
PineTree Motors restructured its business model with ImpelHub’s guidance, resulting in the following:
- Shift to 75% B2B operations
- Strengthened partnerships
- Higher engagement rates
These examples highlight how ImpelHub turns data into actionable growth strategies tailored to specific industries.
Strategic Implementation Process
ImpelHub simplifies complex data analysis by combining automated tools with expert insights. It evaluates key areas like revenue streams, marketing performance, core metrics, and customer segmentation.
“ImpelHub merges AI’s analytical power with human expertise to deliver context-aware growth blueprints and efficient execution plans.” ImpelHub
Business Intelligence Features
The platform provides a comprehensive set of features to support strategic decision-making:
- Contextual Analysis: Analyzes data about business context, helping stakeholders understand the “why” behind performance metrics. For example, it can correlate sales data with market trends or seasonal fluctuations.
- Identifying High-Return Opportunities: This process pinpoints areas with the most significant potential for ROI by analyzing customer behavior, product performance, and market demand. For instance, it can reveal underutilized sales channels or emerging customer segments.
- Creating Actionable Strategies: Transforms raw data into clear, strategic recommendations, such as optimizing marketing campaigns, adjusting pricing strategies, or reallocating resources to high-performing areas.
- Highlighting Feature Gaps: This method detects missing capabilities or underdeveloped features in products or services. This insight can drive innovation, improve customer satisfaction, and maintain a competitive edge.
Data-Driven Decision Support
ImpelHub’s recommendations are easy to understand, vetted by experts, and fine-tuned using customer feedback. They align perfectly with your business’s unique needs, ensuring decisions are both practical and impactful.
This seamless mix of AI and human expertise equips businesses with the tools to make smarter, data-backed decisions.
Conclusion
AI analytics tools are reshaping how businesses make decisions, with clear examples showing their impact. Companies using these tools have seen improvements in efficiency, customer satisfaction, and revenue. These results, spanning various industries, highlight the practical value of AI analytics.
According to McKinsey, businesses using AI analytics report a 15% to 40% boost in productivity . This jump comes from AI’s ability to process massive amounts of data quickly and accurately, helping organizations make faster and smarter decisions.
Companies like Walmart, British Airways, and Verizon have already seen measurable gains by integrating AI into their strategies. These tools have driven advancements in retail, operations, and customer service.
The future of AI analytics holds even more potential. With IDC estimating the global datasphere will grow to 181 zettabytes by 2025, businesses of all sizes can tap into advanced insights. Companies can create data-driven strategies that fuel growth and innovation by automating repetitive tasks and combining AI with human expertise.
