AI vs Traditional Business Intelligence: A Comparison

For years, businesses relied on traditional BI tools to make sense of their data, mostly looking in the rearview mirror. Analysts would dig in to generate reports and hope the insights arrived before the moment passed. It worked… until the pace of business outgrew the speed of those tools.
Now, we’re in a world that demands real-time decisions and forward-looking insights. That’s where AI Business Intelligence changes everything. Instead of just telling you what happened, AI can predict what’s coming next and even suggest what to do about it.
It automates the heavy lifting, analyzes massive amounts of data in seconds, and adapts as new information rolls in. This isn’t just a better BI system; it’s a smarter way to run your business.
Traditional business intelligence is built on structured data, manual processes, and fixed reporting. It helps businesses track historical performance using dashboards and predefined queries. While it’s reliable for understanding what happened, it struggles to offer real-time insights or adapt quickly to change. As a result, decision-making can be slow and reactive rather than agile and forward-looking.

In traditional BI systems, gathering and preparing data often involves a lot of manual work. Teams may pull spreadsheets from different departments, clean and merge the data in Excel, and then upload it into reporting tools. For example, a sales manager might spend hours each week consolidating regional sales numbers just to produce a monthly performance report. This process is not only time-consuming but also increases the risk of human error.

Traditional BI relies heavily on fixed key performance indicators (KPIs) and standard reports that are created ahead of time. If a business question changes mid-quarter, it can take weeks to build a new report or dashboard. Imagine a retail company wanting to track the impact of a sudden pricing change—but their existing dashboard only shows last month’s performance. By the time a new report is built, the opportunity to pivot may have already passed.
Traditional BI tools are great at summarizing past data like how many units were sold last quarter or which region performed best. But they typically don’t explain why something happened or what might happen next. A finance team might know their expenses jumped in Q2, but without deeper AI-driven analysis, they can’t easily uncover patterns or predict future cash flow issues.
These systems often require a dedicated data analyst or IT team to run queries, interpret results, and maintain infrastructure. A marketing manager wanting to understand customer churn trends might need to submit a ticket to the BI team and wait days for the analysis. This dependency creates bottlenecks and slows decision-making, especially in fast-moving industries.
Traditional business intelligence tools, while valuable in the past, struggle to keep up with the demands of today’s fast-moving, data-driven world:
By the time insights are gathered and reports are built, the opportunity may have already passed.
Business users have to wait for data teams to update dashboards or run custom reports—slowing down decisions.
It’s great at telling you what happened, but not what’s going to happen or what you should do next.
In a world where business models pivot quickly, static dashboards and rigid data pipelines can’t keep up.
AI business intelligence is like giving your data a brain and a voice. By leveraging machine learning, natural language processing, and automation, AI-powered BI doesn’t just tell you what happened; it helps you understand why it happened and what to do next.
Instead of manually digging through static dashboards, business leaders can now get real-time answers in plain English, receive predictive insights, and even act on automated recommendations—all without needing to be data scientists.
Let’s say you’re running an eCommerce brand. Traditional BI might show you that sales dipped last month. But AI BI will alert you the moment conversion rates drop, suggest that it may be due to slow page speed, and even recommend a fix. It turns raw data into action.

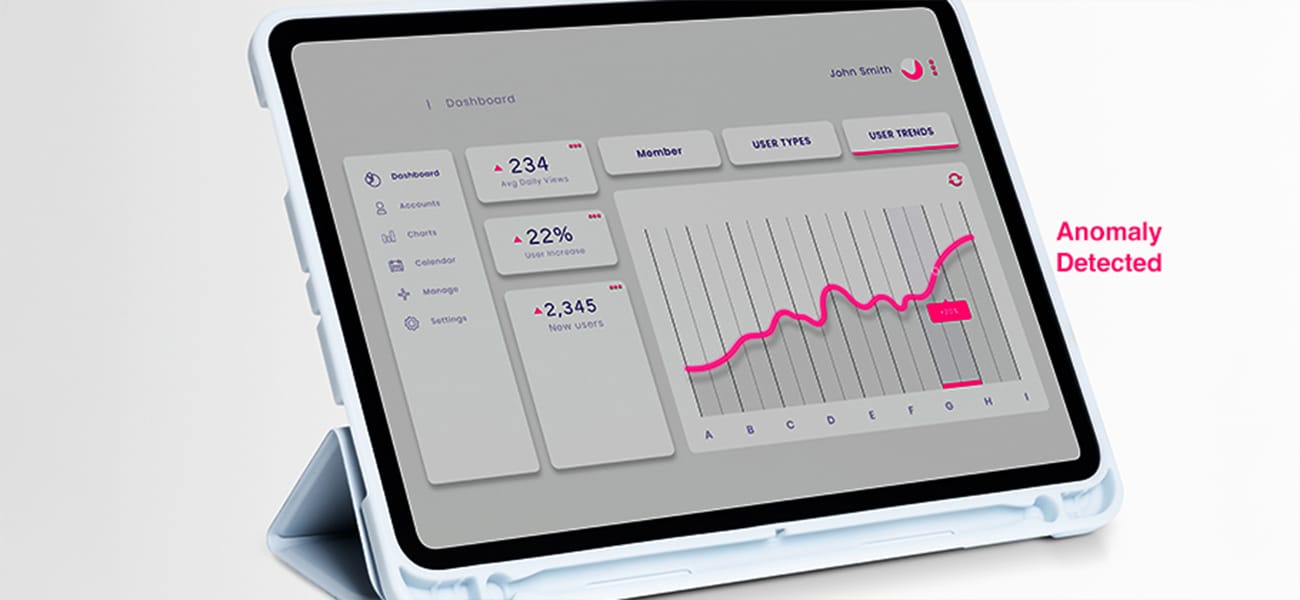
Instantly flag unusual spikes or dips like a sudden drop in customer engagement, so you can act fast.
Forecast future sales, inventory needs, or customer churn with incredible accuracy.
Say goodbye to building reports from scratch. AI tools can generate visuals and summaries on the fly.
Ask “Why did revenue drop last week?” and get a clear answer. No SQL required.
The system gets smarter over time, improving recommendations and adapting to new trends.
Adopting AI Business Intelligence isn’t just about keeping up with tech trends—it’s about transforming how your business makes decisions, scales, and competes. ImpelHub’s new feature, Battleboard™, takes this a step further by enabling in-depth competitive benchmarking. This interactive, visual tool allows your team to explore and engage with competitive insights in real time. With side-by-side graphs of your business versus key competitors, you can identify strengths, gaps, and opportunities in real time.
Here’s how AI is reshaping the BI landscape:
With AI, data analysis happens in real time. Imagine getting a notification the moment customer churn spikes—no more waiting days for a report. You can make swift, data-backed decisions exactly when it matters most.

AI looks ahead, not just behind. Say you’re running a subscription business: AI can forecast churn rates and even recommend retention strategies like sending targeted offers before customers cancel.
Manual reports often come with human error. AI minimizes that by continuously learning from patterns and anomalies in your data, delivering sharper, more accurate insights you can trust.
As your business grows, so does your data. AI BI can seamlessly pull from CRMs, ERPs, social channels, and more—no sweat. Whether you’re a startup or an enterprise, it scales with you.
You don’t need to be a data scientist to use AI BI. With natural language capabilities, your sales team can simply ask, “What’s our best-performing product this quarter?” and get instant, visual answers.

A mid-sized eCommerce company using ImpelHub, an AI-powered BI platform, reduced reporting time by 60% and increased conversion rates by acting on real-time customer behavior trends. That’s the power of turning insights into action.
Interested to know how ImpelHub makes it happen? Read it here.
Feature | Traditional BI | AI Business Intelligence |
Data processing | Batch/Manual | Real-time/automated |
Insight type | Descriptive (what happened) | Predictive & prescriptive (what next?) |
Scalability | Limited | Highly scalable |
Use accessibility | Technical users | Non-technical users with NLP |
Adaptability | Static dashboards | Dynamic, learning systems |
Speed of decision making | Slower | Instant recommendations |
Bring all your critical data—sales, marketing, operations, customer behavior—into a centralized platform. The more connected your data, the better the AI can uncover patterns and insights.
Use an AI-powered solution like ImpelHub, which combines machine learning and human expertise to help you spot trends, predict outcomes, and make smarter business decisions faster.
Go beyond historical metrics. With AI, you can track forward-looking KPIs like customer churn risk, sales forecasts, or product demand—helping you anticipate rather than react.
Let AI handle the heavy lifting. Automatically generate dynamic dashboards and real-time reports tailored for different teams—no manual work needed.
Use AI-driven suggestions to tweak campaigns, adjust inventory, or optimize workflows—turning insights into immediate, impactful action.
Imagine a retail chain like Target automatically analyzing daily sales, restocking inventory based on predicted demand, and sending alerts when anomalies arise—all without human input. AI-powered BI handles data ingestion, cleansing, analysis, and insight delivery on autopilot.

Think of your BI tool like Siri or Alexa for business data. A sales manager at a logistics firm can say, “What were our top-selling SKUs last month in the Midwest?” and get an instant answer—no SQL or dashboard drilling required. Tools like Power BI with Copilot or ImpelHub enable natural language queries, breaking down barriers for non-technical users.
Instead of just knowing that Q1 revenue dropped, AI BI platforms like ImpelHub can analyze historical trends, flag early warning signs, and suggest corrective actions—such as shifting marketing spend or adjusting pricing to offset expected dips in customer demand.
Modern BI is moving beyond siloed reporting. For example, a SaaS company could connect data from CRM, email campaigns, support tickets, and billing software into one AI-driven BI platform. This allows marketing to adjust campaigns based on churn patterns or product teams to prioritize features linked to higher retention.
Companies like HubSpot or Shopify are equipping every employee, from the CX intern to the CFO with dashboards powered by AI that surface real-time KPIs. No more waiting days for analysts to build custom reports. Everyone gets self-serve access to insights they can act on.
Traditional BI served us well, but in today’s digital-first, data-saturated environment, it’s no longer enough. AI Business Intelligence represents the next frontier of strategic decision-making. By automating analysis, predicting trends, and personalizing insights, AI is transforming BI into a powerhouse for growth.
Want to move beyond reporting to real-time, AI-powered decisions? Explore how platforms like ImpelHub can help.
2 combos (1 competitor × 2 dimensions)
20 combos $5 per additional combo
100 combos $4 per additional combo
280 combos $3 per additional combo

7 Steps / 8 – 10 days / 2 – 3 hours of your time
Maximize your impact with ImpelHub’s Growth Lever Identifier—our AI-powered system that discovers your single biggest growth lever and accelerates your success. By analyzing your revenue streams, marketing channels, and core metrics, it highlights the most effective path to scalable growth and pinpoints your highest-ROI strategy, so you can focus on what truly matters, multiply your revenue, and stay ahead in today’s competitive market. Our clear, data-driven action plan ensures you can scale faster and more efficiently than ever.
Insight360, part of the “Your Business” pillar in the Business Brain/Context framework, delivers data-driven insights across 9 categories and 40+ business aspects, including market positioning, competition, revenue, trends, and brand identity.
It drives two key outputs:
With a multidimensional business view, Insight360 helps optimize positioning, enhance engagement, and accelerate growth.
Insight360+ expands on Insight360 with 15 additional dimensions, offering a deeper analysis of business strategy. It provides a self-reflective framework to uncover opportunities in:
With Insight360+, businesses refine strategies, strengthen positioning, and drive sustainable growth.
FanScope is a comprehensive catalog of buyer types, categorized by 10 key attributes, helping decision-makers assess and refine target audiences before segmentation.
As the first step in segmentation, FanScope informs:
By analyzing buyer roles, revenue segments, and purchase probabilities, FanScope enhances targeting, optimizes resources, and improves sales and marketing efficiency.
The Segmentation Module enhances customer targeting with Rated ICPs, Personas, and Firmographics (B2B), assessing each ICP across 22 attributes, including:
ICP Scoring evaluates profiles on 10 numerical dimensions, enabling businesses to prioritize high-value targets efficiently.
FoeScope is a competitive analysis framework that evaluates competitors across three revenue segments—small, medium, and large—relative to the business’s revenue. It assesses:
As a precursor to CounterEdge, FoeScope helps businesses identify and categorize key competitors, setting the stage for deeper competitive strategy development.
CounterEdge analyzes competitor growth strategies, their impact on the business, and countermeasures to stay competitive. It evaluates:
By leveraging CounterEdge, businesses can anticipate threats, mitigate risks, and implement winning strategies.
NextMove is a growth strategy framework that helps businesses identify, evaluate, and implement high-impact strategies. Each strategy is numerically rated across 10 dimensions, similar to ICP Rating, to prioritize the most effective paths for expansion.
With NextMove, businesses gain a data-driven approach to strategic growth, ensuring scalability, market expansion, and long-term success.
Launch-Execution Blueprint creates high-level execution plans for growth strategies, prioritizing them based on impact, feasibility, and business alignment.
By leveraging Launch-Execution Blueprint, businesses can streamline execution, focus on high-impact strategies, and drive measurable growth.
Maximize your impact with ImpelHub’s AI-powered Growth Lever Identifier. By analyzing revenue streams, marketing channels, and core metrics, it uncovers your biggest growth lever and highest-ROI strategy.
With a clear, data-driven action plan, you can focus on what matters, scale faster, and stay ahead in today’s competitive market.
Maximize your impact with ImpelHub’s Growth Lever Identifier—our AI-powered system that discovers your single biggest growth lever and accelerates your success. By analyzing your revenue streams, marketing channels, and core metrics, it highlights the most effective path to scalable growth and pinpoints your highest-ROI strategy, so you can focus on what truly matters, multiply your revenue, and stay ahead in today’s competitive market. Our clear, data-driven action plan ensures you can scale faster and more efficiently than ever.
Feature Gap Analysis is a powerful tool within ImpelHub that identifies missing or desired features based on the needs and expectations of the target audience. By leveraging Business Brain, it ensures that feature recommendations are strategically aligned with business goals and market demand.
Key Benefits:
Identifies Missing Features – Pinpoints gaps in the product or service offering.
Aligns with Target Audience Needs – Ensures features meet user expectations.
Prioritization via Impact Scoring – Helps decision-makers invest wisely.
Data-Driven Scoring Mechanism
Each feature is rated across five numerical dimensions, enabling businesses to prioritize development efforts effectively:
Revenue Boost
Cost Reduction
Customer Acquisition
Customer Retention
Customer Satisfaction
By leveraging Feature Gap Analysis, businesses can make informed investment decisions, enhance their product-market fit, and drive customer engagement and growth
UXI (User Experience Investigation) is a UI/UX audit framework that evaluates core business pages with unparalleled depth, powered by ImpelHub Audit. Unlike standard audits, ImpelHub leverages Business Brain, ensuring that recommendations are contextually aligned with the company’s strategy, market position, and growth objectives.
Key Audit Components:
Feature & Objective – Identifies key UI/UX elements and their purpose.
Details & Justification – Explains audit findings in a business-relevant manner.
Impact & Area – Evaluates influence on user experience.
Rationale – Context-driven reasoning for suggested improvements.
Impact-Driven Scoring Mechanism
Each UI/UX strategy is numerically rated across five dimensions, helping decision-makers prioritize investments:
Revenue Boost
Cost Reduction
Customer Acquisition
Customer Retention
Customer Satisfaction
This data-driven scoring allows businesses to allocate resources effectively, ensuring maximum ROI on UI/UX improvements and driving sustained growth
Detailed Execution Blueprint is a task list and project roadmap that breaks down high-level strategies into step-by-step, week-by-week execution plans, ready for team assignment and implementation.
Key Features:
Detailed Task Breakdown – Converts strategies into actionable steps.
Week-by-Week Execution Timeline – Ensures structured and phased implementation.
Team Assignments – Each plan is ready to be assigned to the relevant team for execution.
Operational Clarity & Accountability – Provides a clear roadmap to track progress.
By leveraging Launch-Detailed Plan, businesses can ensure smooth execution, improve efficiency, and drive successful implementation
FanScope is an extensive catalog of potential buyer types, both direct and indirect, categorized using 10 key attributes. It helps decision-makers identify, evaluate, and include or exclude buyer types before the segmentation process.
As the first step toward segmentation, FanScope informs:
ICP (Ideal Customer Profile) Definitions
Persona Development
Firmographics (B2B segmentation)
ICP Scoring
By analyzing buyer roles, revenue segments, pain points, and purchase probabilities, FanScope enables businesses to refine their target audience, optimize resource allocation, and improve sales and marketing efficiency.
The Segmentation Module refines customer targeting through Rated ICPs, Personas, and Firmographics (B2B). Each ICP is assessed across 22 attributes, covering:
Profile & Behavior – Segment, characteristics, decision-makers, and buying behavior.
Business Fit – Pain points, goals, product needs, and purchase drivers.
Engagement Factors – Technology, content consumption, marketing channels, and objections.
Strategic Insights – Value proposition, competition, and customer service needs.
ICP Scoring rates each profile on 10 numerical dimensions, helping decision-makers quickly prioritize the best targets for sales and marketing strategies
FoeScope is a competitive analysis framework that identifies and evaluates competitors across three revenue segments—small, medium, and large—relative to the business’s revenue. It assesses competitors based on:
Key Products/Services – Most similar offerings.
Geography – Market overlap.
Target Audience – Shared customer base.
Similarity Score & Reasoning – Measures alignment with the business.
FoeScope serves as a precursor to CounterEdge, laying the groundwork for deeper competitive strategy development by helping businesses identify and categorize their most relevant competitors
CounterEdge analyzes competitor growth strategies, their impact on the client’s business, and countermeasures to stay competitive. It evaluates:
Competitor Strength & Market Impact – Key advantages and threat level.
Affected Business Touchpoints – Areas influenced by competition.
Adaptation Strategy – Actionable countermeasures.
Impact Grade & Rationale – Severity of threat (1-5).
Potential Business Benefits – Strategic opportunities.
By leveraging CounterEdge, businesses can anticipate threats, mitigate risks, and implement winning strategies.
NextMove is a growth strategy framework designed to help businesses identify, evaluate, and implement high-impact strategies. Each strategy is numerically rated across 10 dimensions, similar to ICP Rating, allowing decision-makers to prioritize the most effective paths for expansion.
Key Assessment Areas:
Strategy Type, Objective & Target Audience – Defines the approach, aligns with Ideal Customer Profiles (ICPs), and ensures relevance to market needs.
Key Tactics & Content Marketing – Outlines the execution plan, including marketing initiatives to drive engagement.
Required Resources & Risk Assessment – Identifies necessary investments, potential risks, and feasibility.
Timeline & Measurement Metrics – Provides a structured roadmap for execution and tracking success.
Relevance (%) & Potential Impact – Scores strategies based on alignment with business goals, market trends, and competitive landscape.
By leveraging NextMove, businesses gain a data-driven approach to strategic growth, enabling them to quickly assess and implement the most effective strategies for scalability, market expansion, and long-term success.
GTM/Scale Up Playbook creates high-level execution plans for selected growth strategies, ensuring effective implementation. It prioritizes strategies based on impact, feasibility, and alignment with business objectives.
Key Components:
Phases – Defines the execution stage.
Strategy Score – Numerical rating for prioritization.
Strategy Suggestions & Rationale – Recommended actions with justification.
Highlights – Key takeaways and strategic advantages.
Related Strategy – Links to complementary approaches.
Targeted ICPs (ICP Phase) – Aligns execution with the right customer segments.
By leveraging GTM/Scale Up Playbook, businesses can streamline execution, focus on high-impact strategies, and drive measurable growth.
Insight360 is a key component of the “Your Business” pillar within the Business Brain/Context framework. It delivers data-driven insights across 9 key categories, covering 40+ critical business aspects, including market positioning, competitive landscape, revenue analysis, industry trends, and brand identity.
These insights drive two strategic outputs:
Custom Growth Strategies – Tailored plans developed with AI, Impelian, Impelist, and human expertise to support business expansion and address key challenges.
Contextual UI/UX Audit – Identifies feature gaps and aligns product offerings with market needs.
Insight360 provides a multidimensional understanding of the business, industry, and competitive landscape. By leveraging these insights, businesses can optimize market positioning, enhance customer engagement, and accelerate growth.
Insight360+ enhances Insight360 by analyzing a business at a deeper level through 15 additional dimensions. It provides a self-reflective framework to uncover strategic opportunities in:
Sales & Revenue Optimization – Pricing models, sales processes, and client strategies.
Market & Digital Presence – Online marketing, industry positioning, and partnerships.
Innovation & Technology – AI /Tech integration and product/service development.
With Insight360+, businesses gain a more comprehensive perspective to refine strategies, strengthen market positioning, and drive sustainable growth.
Founder & CEO

Co-Founder & Chief Revenue Officer
Please enter your email to download the Sample Score Card.
Please enter your email to download the playbook.
Unlock exclusive tools for growth